
In our previous post we looked at how we can embed JavaFX components into Swing applications. As Java Swing lacks Charting API, we can make use of the JavaFX Chart API and not depend on other 3rd party libraries like JFreeChart and others. The javafx.scene.chart is the package which contains all the charting related classes. In this example we will look at creating Scatter Charts and Bar Charts which are categorized as XYCharts which is nothing but these charts are plotted on a X and Y axis. The classes for the charts to be used are javafx.scene.chart.ScatterChart and javafx.scene.chart.BarChart. If you happen to look at the declaration of these classes, they accept generic types where X indicates the type on the X Axis and Y indicates the type on the Y axis. These charts require a set of axis to be defined before they are used. If the axis is of type Number, then one can use NumberAxis and for String values one can make use of CategoryAxis. For each of the Number axis or category axis we can define the range of of values to be plotted on the axis. Let me show some code on how it can be achieved:
NumberAxis yAxis =
    new NumberAxis(0.0,5.0,1.0);
NumberAxis xAxis =
    new NumberAxis(0.0,5.0,1.0);
//Scatter chart with 2 axis defined. Both are number axis
ScatterChart scatterChart =
    new ScatterChart<>(xAxis,yAxis);
also read:
For a Chart with a Category and Number axis, we can have something like:
NumberAxis lineYAxis =
    new NumberAxis(0,100_000,10_000);
CategoryAxis lineXAxis =
    new CategoryAxis();
//One can set the label for axis as well.
lineYAxis.setLabel("Sales");
lineXAxis.setLabel("Products");

// A bar chart with X and Y axis representing
// string and numbers.
BarChart barChart =
    new BarChart<>(lineXAxis,lineYAxis);
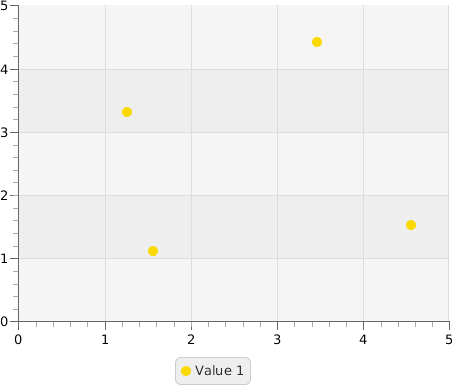
Moving ahead, our next task is to add some data to these charts. As you already have seen, the scatter chart accepts data while the bar chart accepts data. The charts being demonstrated in our example here are XY charts which means that they are plotted against X Axis and Y Axis, so we use XYChart at all places. Lets populate some data to our scatter chart
XYChart.Series series = new XYChart.Series<>();
series.setName("Value 1");
series.getData().add(getData(1.2,3.4));
series.getData().add(getData(3.4,4.5));
series.getData().add(getData(1.5,1.2));
series.getData().add(getData(4.5, 1.6));
where our function getData is defined as
private XYChart.Data getData(double x, double y){
  XYChart.Data data = new XYChart.Data<>();
  data.setXValue(x);
  data.setYValue(y);
  return data;
}
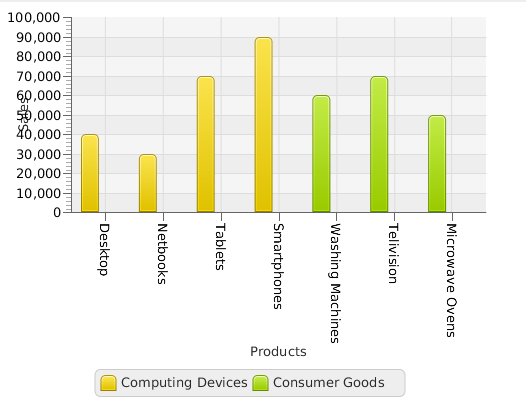
To populate the data for bar chart we write something like:
// First Series
XYChart.Series bar1 = new XYChart.Series<>();
bar1.setName("Computing Devices");
bar1.getData().add(getData(40000,"Desktop"));
bar1.getData().add(getData(30_000,"Netbooks"));
bar1.getData().add(getData(70_000,"Tablets"));
bar1.getData().add(getData(90_000,"Smartphones"));

//Second series
XYChart.Series bar2 = new XYChart.Series<>();
bar2.setName("Consumer Goods");
bar2.getData().add(getData(60_000,"Washing Machines"));
bar2.getData().add(getData(70_000,"Telivision"));
bar2.getData().add(getData(50_000,"Microwave Ovens"));

// Add both the series to the bar chart
// Notice the use of addAll() method here
// and only add() for scatter chart
barChart.getData().addAll(bar1,bar2);
Once the program is working, the above 2 graphs would be represented as:
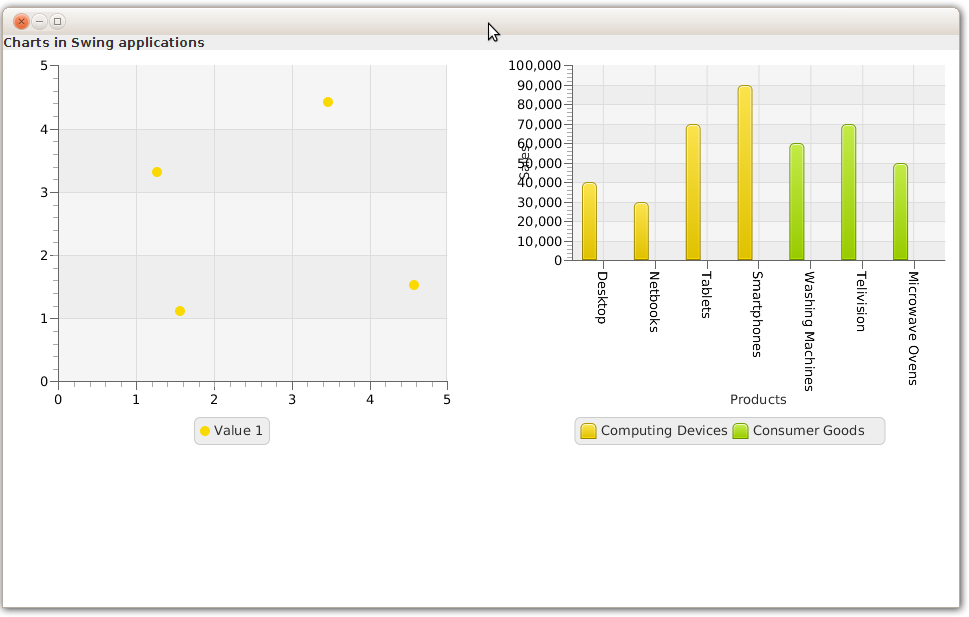
Now that we have touched upon the basics of adding chart, the other things which are to be taken care are the layout of the JavaFX components and then adding the JFXPanel into a JFrame. If you dont know what a JFXPanel is please read this post for some information on the same.
The complete code for this sample is:
import javafx.application.Platform;
import javafx.beans.property.SimpleListProperty;
import javafx.embed.swing.JFXPanel;
import javafx.scene.Scene;
import javafx.scene.chart.*;
import javafx.scene.layout.GridPane;

import javax.swing.*;
import java.awt.*;

public class JavaChartDemo {

  public static void main ( String[] args){
    SwingUtilities.invokeLater(new Runnable() {
      @Override
      public void run() {
        ChartFrame mainFrame = new ChartFrame();
        mainFrame.setVisible(true);
        }
      });
    }
  }

class ChartFrame extends JFrame {

  JFXPanel fxPanel;
  public ChartFrame(){
    initSwingComponents();

    initFxComponents();
  }

  private void initSwingComponents(){
    JPanel mainPanel = new JPanel(new BorderLayout());
    fxPanel = new JFXPanel();
    mainPanel.add(fxPanel, BorderLayout.CENTER);

    JLabel titleLabel = new JLabel("Charts in Swing applications");
    mainPanel.add(titleLabel, BorderLayout.NORTH);

    this.add(mainPanel);
    this.setDefaultCloseOperation(JFrame.EXIT_ON_CLOSE);
    this.setSize(800,400);
  }

  private void initFxComponents(){

    Platform.runLater(new Runnable() {
      @Override
      public void run() {
          GridPane grid = new GridPane();
          Scene scene = new Scene(grid, 800, 400);

          /**
           * Construct and populate Scatter chart
           */
          NumberAxis yAxis = new NumberAxis(0.0,5.0,1.0);
          NumberAxis xAxis = new NumberAxis(0.0,5.0,1.0);
          ScatterChart scatterChart =
            new ScatterChart<>(xAxis,yAxis);
          XYChart.Series series =
            new XYChart.Series<>();
          series.setName("Value 1");
          series.getData().add(getData(1.2,3.4));
          series.getData().add(getData(3.4,4.5));
          series.getData().add(getData(1.5,1.2));
          series.getData().add(getData(4.5, 1.6));
          scatterChart.getData().addAll(series);
          grid.add(scatterChart,0,0);

          /**
           * Construct and populate Bar chart.
           * It uses 2 series of data.
           */
          NumberAxis lineYAxis =
            new NumberAxis(0,100_000,10_000);
          lineYAxis.setLabel("Sales");
          CategoryAxis lineXAxis = new CategoryAxis();
          lineXAxis.setLabel("Products");
          BarChart barChart =
            new BarChart<>(lineXAxis,lineYAxis);
          XYChart.Series bar1 =
            new XYChart.Series<>();
          bar1.setName("Computing Devices");
          bar1.getData().add(getData(40000,"Desktop"));
          bar1.getData().add(getData(30_000,"Netbooks"));
          bar1.getData().add(getData(70_000,"Tablets"));
          bar1.getData().add(getData(90_000,"Smartphones"));

          XYChart.Series bar2 = new XYChart.Series<>();
          bar2.setName("Consumer Goods");
          bar2.getData().add(getData(60_000,"Washing Machines"));
          bar2.getData().add(getData(70_000,"Telivision"));
          bar2.getData().add(getData(50_000,"Microwave Ovens"));

          barChart.getData().addAll(bar1,bar2);
          grid.setVgap(20);
          grid.setHgap(20);
          grid.add(barChart,2,0);
          fxPanel.setScene(scene);
        }
      });

  }

  private XYChart.Data getData(double x, double y){
    XYChart.Data data = new XYChart.Data<>();
    data.setXValue(x);
    data.setYValue(y);
    return data;
  }

  private XYChart.Data getData(double x, String y){
    XYChart.Data data = new XYChart.Data<>();
    data.setYValue(x);
    data.setXValue(y);
    return data;
  }
}
We will try to update and posts JavaFX chart specific examples. Please do subscribe to the posts to keep a track of the new updates.
 Embedding HTML into Java Swing Applications